Step 6 – Calculate metric ratings As noted above, there are a variety of metrics suitable for use with vegetation types, management needs, and available capacities and data for measurement. At local sites, and particularly in rangelands, protocols for field measurement and subsequent summary calculations have been well-developed through the Bureau of Land Management’s Assessment Inventory and Monitoring (AIM) Program and related activities with the Natural Resource Conservation Service (NRCS) and Agricultural Research Service (ARS). Protocols are now available for several rangeland health or ecological integrity assessments (EIA). Rangeland health assessments based on ecological integrity concepts have been developed by BLM and ARS (e.g., Pellant et al. 2005, Herrick et al. 2017). Rapid field assessments based on the EIA Framework are available for a variety of wetland ecosystems, including a national wetland assessment method developed by NatureServe (Faber-Langendoen et al. 2012, 2016b, Comer et al. 2017) and various states (Colorado – Lemly and Gilligan 2015, Washington – Rocchio and Crawford 2011). Several states have both upland and wetland EIA assessments in place, including Washington (Rocchio and Crawford 2011). Field manuals and field forms are available from NatureServe and several of its Network Programs, including the Colorado Natural Heritage Programs and the Washington Natural Heritage Program.
Step 7 – Reporting on ecosystem condition
As with calculating metrics, there are a variety of suitable ways to report on metric ratings, and these vary considerably with target resource, management, and reporting needs. The goal is to ensure that the results reach the right people in a format that is accessible and useful (Mitchell et al. 2014). This could be a factsheet that highlights the overall results of assessment findings or a more detailed report that includes results of individual metrics. See for example Pellant et al. (2018) for a thorough explanation on reporting on, or describing, indicators of rangeland health (DIRH).
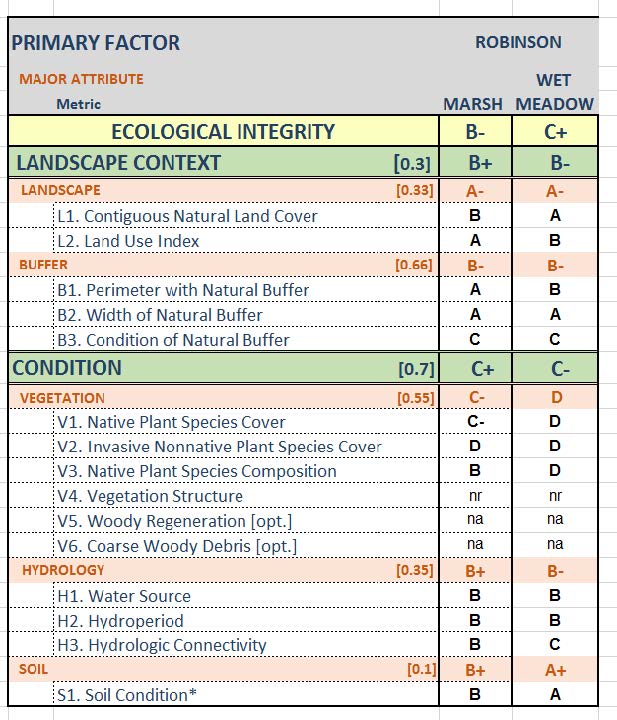
More generally, a common approach for summarizing ecological integrity for a local site is a scorecard that displays the ratings for each metric. This brings information together in a transparent way, allowing users to understand the status of various components of ecological integrity, and if desired, provide an overall rating. By displaying both the individual metrics, and any aggregate scores, the scorecard can provide a multi-factorial view of the site, and pinpoint areas of concern. When several metrics show low ratings, they may point to needs for intensive intervention and restorative treatments. Figure 8.6 illustrates results for wetland sites where restoration and monitoring are planned. Scoring here has been distinguished for marsh and wet meadow zones of this coastal marsh complex. The scorecard includes individual metric scores (A-D). For example, broader Landscape metric ratings were A and B, whereas metrics used to assess Vegetation mostly fell into the C and D range, primarily driven by the proportional cover of Invasive Nonnative Plant Species. However, Native Plant Species Composition scored quite differently between Marsh and Wet Meadow zones, with B for Marsh and D for Wet Meadow.
As summarized in Figure 8.6, individual metrics were aggregated to indicate B scores (B+ and B-respectively for Marsh and Wet Meadow) for Landscape Context, and C scores (C+ and C-) for Condition. The overall EIA ratings were B- for the Marsh zone and C+ for the Wet Meadow zone.
The scorecard approach is important, in that while any one metric may be failing (e.g., a D score), the scorecard provides a multi-factorial view of the system and provides some context for interpreting the significance of any individual rating. Specific management actions tend to be directed at individual metrics and/or small groups of closely related metrics. The D rating for Native Plant Species Composition and this site’s Wet Meadow zone can be explained by the dominance of reed canary grass. Targeted herbicide treatments, combined with prior actions to restore hydrologic connectivity (currently scored as C), may be the specific suggested actions. These specific metrics may be targeted for periodic re-measurement over the coming years.
Other users of the results may be more interested in aggregate scores and/or other forms of reporting that facilitate recognition of broader patterns within and among multiple restoration sites. Maps, generalized tabular summaries, and other forms of infographics, may be suitable for these types of applications.
Next Page: Resources
Author
Patrick Comer, Ph.D., Chief Ecologist
NatureServe