Step 4 -Selection of indicators and metrics
Having identified the target resource types and worked through the conceptual ecological model to identify the KEAs for which indicators are needed, the next step is to select indicators and metrics. Indicators are a measurable expression of the KEA (e.g., native species composition). Metrics are the specific forms of measurement (e.g., proportion of native to non-native species present in sample plots or transects).
Metrics specify both a) the measures needed to quantify the indicators and b) the rating scale by which those measures are informative of the integrity of the ecosystem. For example, Primary Productivity might be a commonly selected KEA for different shrubland, shrub steppe, and grasslands on DoD land. But it can be measured using a variety of methods, including a) by clipping once at the end of the season, b) sequentially during the growing season, or c) using proxy methods based on stem density or height (Pellant et al. 2018). Each of these methods uses different field measures and generates somewhat different numerical values; some may be hard to measure; others, expensive to measure. Thus, a specific metric of the indicator needs to be selected that is ecologically relevant and appropriate for meeting the manager’s needs.
Step 4.1 -Selecting metrics
When selecting metrics, the goal is to identify those that can most effectively characterize current conditions and/or be sensitive to change over time. Indicators of key ecological attributes that directly measure changes to the KEAs (e.g., hydroperiod, native species composition, coarse woody debris in forests) are referred to as “condition indicators.” In contrast, “stressor indicators” directly measure ecosystem stressors (e.g., non-native plant species abundance, number of ditches or diversions in a wetland, proximity to converted lands and roads), which are used to infer the condition or integrity of the system. Condition metrics are preferred because they are a more direct measure of ecological integrity. But stressors metrics are more commonly selected where field measurement is less feasible.
In cases where identifying a condition metric is not feasible, a stressor metric is suitable, especially where its relationship to ecological condition is well understood. For example, the expected native species composition or presence of functional groups of species are commonly identified KEAs, but the practical indicator for them might be Nonnative plant taxa because it is simpler to assess and typically is strongly correlated with native species composition. There are various metrics available to guide the application of this indicator, including percent nonnative species richness, relative cover of nonnative taxa, or the absolute cover of nonnative taxa. The presence and cover of non-native plants are then measured in the field using visual assessments in plots or transects.
Metrics can be identified using a variety of expert-driven processes and/or through data-driven calibration tests. The scientific literature should be reviewed to identify existing and tested metrics that are useful for measuring ecological integrity. For example, NatureServe’s wetland assessment method was initially prototyped from a variety of existing rapid assessment and monitoring materials, particularly the California Rapid Assessment Manual (Collins et al. 2006, Stein et al. 2009) and the Ohio Rapid Assessment Manual (Mack 2001), (Faber-Langendoen et al. 2008). It was then field tested and statistically validated to achieve a rigorous set of wetland integrity metrics (Faber-Langendoen et al. 2012). State-based versions of these assessments are also available in Colorado (Lemly et al. 2015) and Washington (Rocchio et al. 2017).
Candidate metrics can be filtered with screening criteria (Andreasen et al. 2001, Tierney et al. 2009, Mitchell et al. 2014). When choosing metrics, some basic questions are often considered (Kurtz et al. 2001):
- Is the metric ecologically relevant? Conceptually relevant metrics are related to the characteristics of the ecosystem or to the stressors that affect its integrity; and can provide information that is meaningful to resource managers.
- Can the metric be feasibly implemented? The most feasible metrics can be sampled and measured using methods that are technically sound, appropriate, efficient, and inexpensive.
- Is the response variability understood? Every metric has an associated measurement error, temporal variability, and spatial variability. The best metrics will have low error and variability compared to baseline measures. In other words, good metrics have high discriminatory ability, and the signal from the metric is not lost in measurement error or environmental noise. Ideally the metric is measured across a range of sites that span the gradient of stressor levels (DeKeyser et al. 2003) and verified to show a clear response to the stressor.
- Is the metric interpretable and useful? The best metrics provide information on ecological integrity that is meaningful to resource managers. However, they may also need to be sufficiently sensitive to detect change over time, particularly changes caused by stressors.
Step 4.2 -Three-level of effort for indicators and metrics
Depending on the purpose and design of the project, indicators of ecological integrity can be identified and assessed using three generalized levels (Brooks et al. 2004, Wardrop et al. 2013). Level 1 (Remote Assessment) relies primarily on remote sensing-based indicators. Level 2 (Rapid Field Assessment) uses relatively simple semi-quantitative or quantitative condition indicators that are readily observed in the field, often supplemented by a stressor checklist (see below). Level 3 (Intensive Field Assessment) requires detailed quantitative field measurements and may include intensive versions of some of the rapid metrics (Stein et al. 2009).
The “3-level approach” to assessments provides the flexibility to develop data for many sites that cannot readily be visited or intensively studied, permits more widespread assessment, while still allowing for detailed data at selected sites. Because the purpose is the same for all three levels of assessment—to measure the status of ecological integrity of a site—it is important that the identification of ecological attributes and the selection of metrics be coordinated. That is, if invasive or woody species encroachment are identified as key stressors, metrics that address these key issues should be identified for each level (Solek et al. 2011).
Where information is available for all three levels across multiple sites, it is desirable to calibrate the levels, to ensure that there is an increase in accuracy of the assessment as one goes from Level 1 to Level 3. For example, data from Level 2 or Level 3 metrics can be used to calibrate the Level 1 remote-sensing based indicators (Mack 2006, Mita et al. 2007, Stein et al 2009).
Other sets of indicators have been developed for local ecosystem types and that experience has allowed for generalized summaries to be established to aid in indicator selection elsewhere. See practical examples of these used by the State of Washington (Rocchio et al. 2020).
Step 5 -Establish assessment gradient and metric ratings
Assessment points and metric thresholds
Using our knowledge of a given ecosystem, we can approximate both the natural variation in a metric and the variation caused by stressors. Thus, our next step in assessing ecological integrity is to establish a range of values and one or more thresholds that distinguish expected or acceptable conditions from undesired ones that warrant further evaluation or management action. These assessment points and thresholds provide the information regarding the trajectory of a metric, whether it is moving away from the expected natural range of variation and towards an undesirable ecological threshold and possible ecosystem collapse.
A simple categorical structure can be used, such that assessment points reflect on the one end, ratings for Very High (i.e., the metric value lies well within its range of natural variability) to Low (i.e., the metric value lies well outside range of natural variability and represents significant ecological degradation, perhaps irreversible). The number of categories will depend on the degree to which various incremental changes in a metric’s values correspond with changing stressor levels. Remote sensing imagery metrics, although able to generate a more continuous set of values (e.g., annual invasive plant cover), may be prone to a high error rate, so assessment points should not be too narrowly defined. Conversely, intensive field-based measures of invasive cover may be able to establish assessment points with 1–5% interval accuracy. Rapid, field-based metric ratings tend to be intermediate, and are most accurately collected using a relatively discrete set of assessment points (three to five assessment points are common).
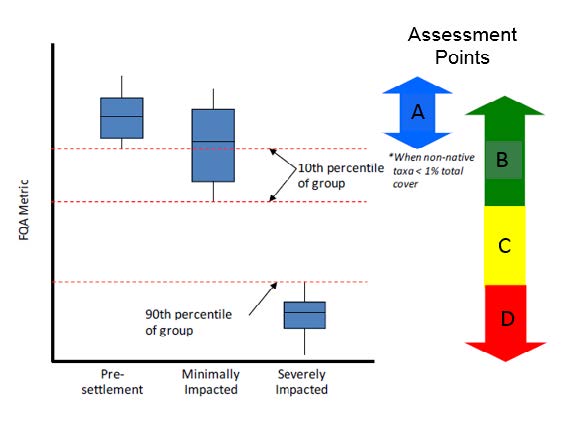
Figure 8.5. illustrates the concept of establishing assessment points, with a desire to characterize four categories (here: A, B, C, and D) using a floristic quality index (Lopex and Fennessy 2002, Freyman et al. 2016) as the metric. It shows assessment point development (adapted from Bourdaghs 2012). Sites are assigned to groups including (“Presettlement” [A], “Minimally Impacted” [B], and “Severely Impacted” [D]). Assessment points are set at designated percentiles of the floristic quality assessment (FQA) metric for each data analysis group. Three types of assessment points are provided: 1) Desired condition (A/B), 2) Early warning (B/C), and 3) Imminent collapse (C/D).
Next Page: Document condition
Author
Patrick Comer, Ph.D., Chief Ecologist
NatureServe